CASE STUDIES Customer Driven Product Design
Transforming Insurance Industry With Real Time Data Analytics
Insurance agencies have multiple systems that power their workflows forcing users to track their tasks and receive workflow status across multiple applications. Managers rely on their legacy systems to output weekly reports that provided productivity of their team from the previous week.
The Challenge
Current reporting process does not account for proper reporting on agent workflow progress.
The managers receive productivity alerts a week late.
Teams are unable to be proactive on upcoming activity, new business development, and oversight of recourse.
Team Makeup
Marty’s Role: Lead the team in the day-to-day design effort to achieve milestones. Facilitate virtual whiteboard sessions with customers. Socialize prototypes, evangelize design thinking methodologies, and provided consultative guidance to executive leadership.
2 Interaction Designer
1 Architect
The Solution
Provide visibility into users workflow processes with the long term goal of automation.
Increase productivity of reporting through a scalable data visualization user interface.
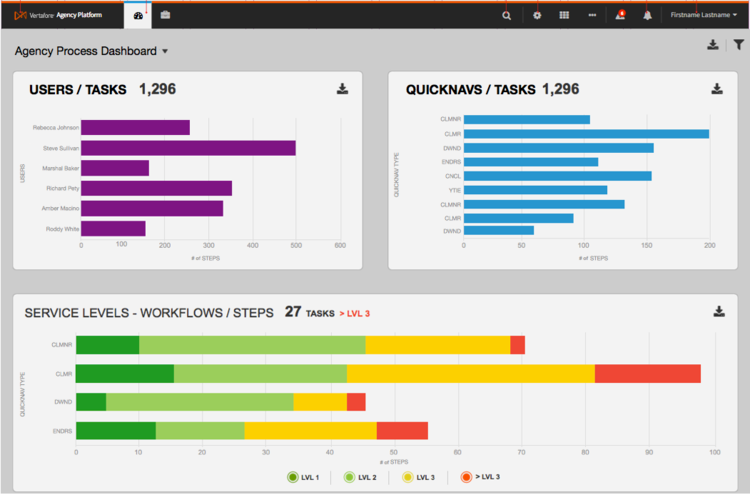
Display real-time information of agency productivity that provides an in-depth understanding of daily work.
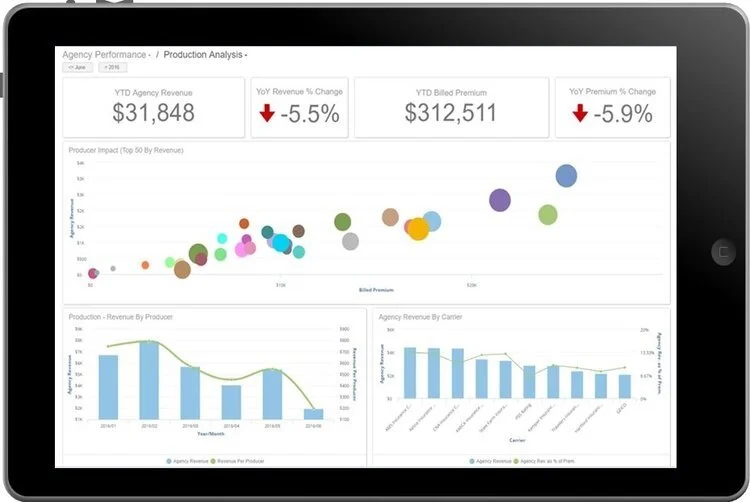
Build a scalable data visualization platform for multiple personas supporting all users in the insurance industry.
Approach
Customer observations
Rapid prototyping with formal *design committee.
*The design committee includes 6-8 customers meeting bi monthly to review concepts, business requirements and prototypes.
Provide Vertafore leadership with weekly progress of findings and next steps that define a strategic roadmap for Tableau implementation.
Ideation
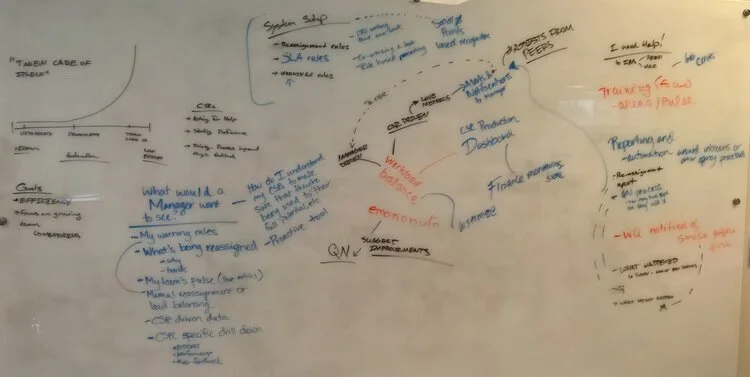
Whiteboard Session
Insights gathered from recent user interviews and business needs inspired the blue prints, process maps and journey maps. These methods aided in the visualization of potential gaps that needed to be prioritized.
Design - Low Fidelity Use Cases
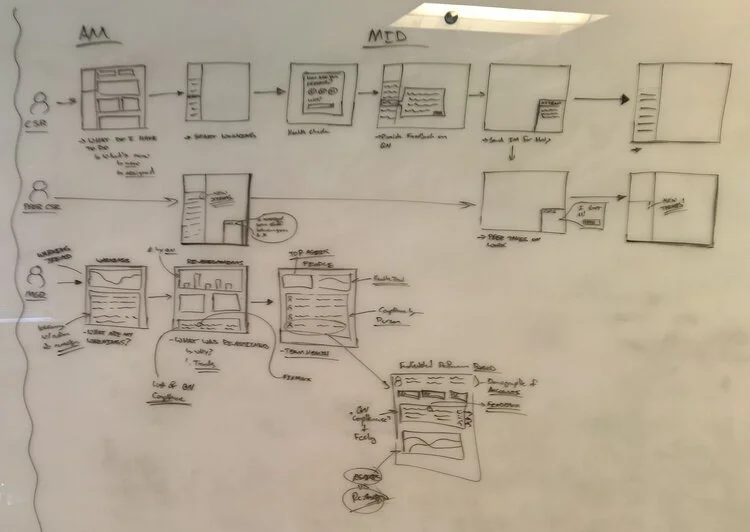
Remove The Complexity Of Data Visualization - Wireframes
Evolving from Ideation to Design is the development of user flows that represent the MVP. This flow was presented to the design committee (6-8 customers) and revealed the ideal approach to solving our customers data analytics challenge.
Field Testing - Prototypes
Design & Test
This prototype was tested in the field with regional customers. Each application of Vertafore’s analytics product is unique to the customer. Leveraging raw data to deliver strategic oversight and business objectives through the data visualization output.
The Results
By leveraging the Design Thinking methodologies, we determined that agency managers ultimately want to empower their users to solve problems, and desire a system to automate workflow monitoring, reassignment, and troubleshooting. This would allow them to devote their time to mentoring agency users and grow their people.
The successful reception of the product during the field test provided Vertafore to move forward with a strategic partnership with Birst to implement a data driven customer facing data visualization onto Vertafore’s platform.


